Hisashi Iwakuma started his professional baseball career in Japan, where he played for eleven seasons in the Nippon League. He quickly developed into one of the league’s most talented players, and began to attract attention from professional teams in the United States. Before the 2012 MLB season started, the Mariners signed Iwakuma to a contract for $1.5 million guaranteed, with incentives. After starting the season in the bullpen, he was moved to the rotation and shined there, eventually being named to the All-Star team in his second season. Looking at Iwakuma’s career in the United States, trying to pinpoint the causes for his success is a difficult and complex task because he doesn’t have the characteristics of a stereotypical ace.
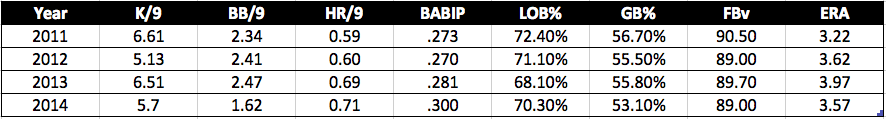
First, Iwakuma doesn’t have overwhelming fastball velocity, as he has consistently averaged around 90 mph. Furthermore, Iwakuma has displayed a broad pitch repertoire. According to BrooksBaseball, Iwakuma throws a fastball, sinker, slider, curve, splitter, and added a cutter this year. He has primarily leaned on his splitter this year, and it has been dominant, drawing nearly 20% whiffs.
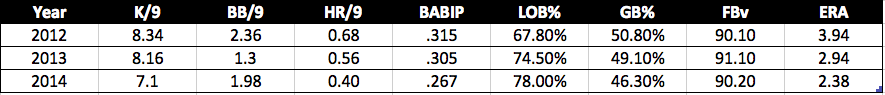
As we dig deeper, we can see that some of Iwakuma’s success can be attributed to a high groundball rate – his GB% of 49.8% is well above the league average of 45%. This helps him limit home runs, which keeps his ERA down.
Iwakuma has consistently allowed a low BABIP. Studies have shown that pitchers do not have much control over their BABIP, so a consistently low BABIP seems a little suspect.
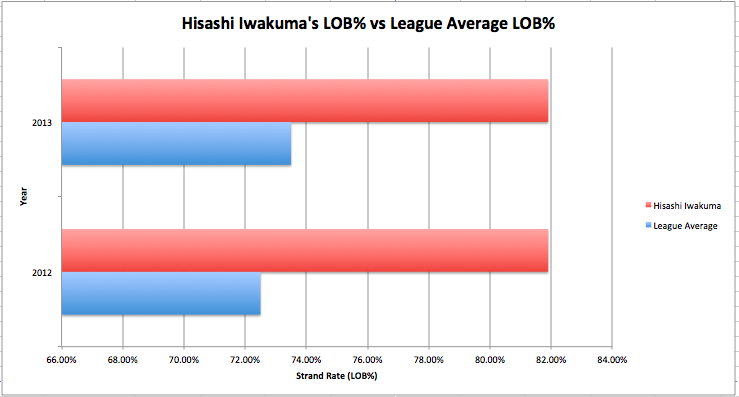
Additionally, Iwakuma has benefited from a very high strand rate (Left On Base Percentage, or LOB%) during his first two seasons here. Pitchers have very little control over their strand rate, and most extreme strand rates result in a regression to the mean during the next season. During Iwakuma’s first two years in the MLB, he had not seen this correction.
First, Iwakuma doesn’t have overwhelming fastball velocity, as he has consistently averaged around 90 mph. Furthermore, Iwakuma has displayed a broad pitch repertoire. According to BrooksBaseball, Iwakuma throws a fastball, sinker, slider, curve, splitter, and added a cutter this year. He has primarily leaned on his splitter this year, and it has been dominant, drawing nearly 20% whiffs.
As we dig deeper, we can see that some of Iwakuma’s success can be attributed to a high groundball rate – his GB% of 49.8% is well above the league average of 45%. This helps him limit home runs, which keeps his ERA down.
Iwakuma has consistently allowed a low BABIP. Studies have shown that pitchers do not have much control over their BABIP, so a consistently low BABIP seems a little suspect.
Additionally, Iwakuma has benefited from a very high strand rate (Left On Base Percentage, or LOB%) during his first two seasons here. Pitchers have very little control over their strand rate, and most extreme strand rates result in a regression to the mean during the next season. During Iwakuma’s first two years in the MLB, he had not seen this correction.
With just this information, it appears that Iwakuma’s first seasons in the United States have been lucky, or some sort of aberration. But Iwakuma’s consistency in putting up these seeming “lucky” numbers makes it appear that he may be “defying regression” in some way. Al Melchior of CBSSports.com first brought this idea to my attention.
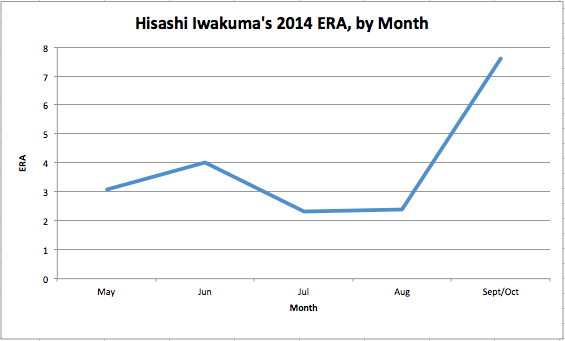
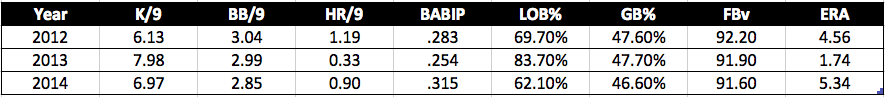
At the start of 2014, Iwakuma seemed to be the same pitcher he was before, and had all the same characteristics. Through the first half of the season, his strand rate was at 79.7%, which is well above the league average. However, in September, Iwakuma faced extreme regression, and his strand rate collapsed to 51.8%. His performance suffered as well, as his BABIP increased to .371 and his ERA for September and October climbed to 7.61.
At the start of 2014, Iwakuma seemed to be the same pitcher he was before, and had all the same characteristics. Through the first half of the season, his strand rate was at 79.7%, which is well above the league average. However, in September, Iwakuma faced extreme regression, and his strand rate collapsed to 51.8%. His performance suffered as well, as his BABIP increased to .371 and his ERA for September and October climbed to 7.61.
After this performance, we are faced with some questions. Was his performance at the end of the season really regression? Or was it bad luck, and Iwakuma is really the elite pitcher he showed before? Can pitchers maintain such a high strand rate?
In an effort to answer some of these questions, I looked at pitcher comparisons for Iwakuma. I tried to find pitchers that fit some of Iwakuma’s key characteristics:
· High strand rate for three consecutive seasons
· Low BABIP for three consecutive seasons
· Above average GB%
· Low fastball velocity
· Non-elite strikeout numbers (<8 K/9)
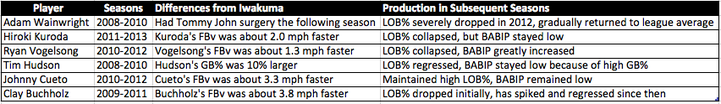
Looking at data from 2002-2014, I ended up finding six pitchers who seemed like the best comparisons for Iwakuma. While none of them were perfect matches, their career trends may provide insight on what we can expect from Iwakuma in future seasons. It is important to note that we are clearly dealing with a small sample size. Six pitchers is not nearly enough to draw definitive conclusions, but it may give us an idea for what we can expect from Iwakuma going forward.
Each player has a comparison to Iwakuma’s 2012-2013 data.
In an effort to answer some of these questions, I looked at pitcher comparisons for Iwakuma. I tried to find pitchers that fit some of Iwakuma’s key characteristics:
· High strand rate for three consecutive seasons
· Low BABIP for three consecutive seasons
· Above average GB%
· Low fastball velocity
· Non-elite strikeout numbers (<8 K/9)
Looking at data from 2002-2014, I ended up finding six pitchers who seemed like the best comparisons for Iwakuma. While none of them were perfect matches, their career trends may provide insight on what we can expect from Iwakuma in future seasons. It is important to note that we are clearly dealing with a small sample size. Six pitchers is not nearly enough to draw definitive conclusions, but it may give us an idea for what we can expect from Iwakuma going forward.
Each player has a comparison to Iwakuma’s 2012-2013 data.
Adam Wainwright

Iwakuma and Wainwright had similar numbers over this span of their career. Both featured non-elite level velocities, and strikeout rates near league average. Wainwright’s control was slightly worse, but he made up for that by allowing fewer home runs.
Wainwright's numbers after his LOB% peak
In 2011, Wainwright had Tommy John surgery, and missed all of the season. When he returned, he was hit with LOB% regression, and his BABIP ballooned. This lead to a much higher ERA in 2011. He settled things down in subsequent seasons, which might have been a result of higher fastball velocity. He never returned to his extreme LOB%, and it took until 2014 to bring his BABIP down to below league average.
Hiroki Kuroda

Kuroda posted very similar numbers to Iwakuma, with the main difference being fastball velocity.

Kuroda's numbers after his LOB% peak
Because Kuroda’s three-year span was more recent, we have limited data to look at after his LOB% peak. He, like Wainwright, experienced extreme LOB% regression in the following season, and his ERA has climbed accordingly. However, he maintained his low BABIP, which has helped him deal with the lower strand rate.
Ryan Vogelsong

Ryan Vogelsong sneaks into this set of players only because he didn’t play in the major leagues in 2010, but the comparison was too good to pass up. Vogelsong features a fastball that has more velocity than Iwakuma’s, but is still relatively close.

Vogelsong's numbers after his LOB% peak
Vogelsong collapsed in 2013, as he saw his LOB% plummet, and allowed home runs at nearly twice the rate he had over the previous two seasons. His LOB% rebounded in 2014, but he didn’t see the same success.
Tim Hudson

Other than the higher GB% rate, the Hudson-Iwakuma comparison is nearly perfect. They both posted very low BABIPs, and limited home runs while stranding runners at a high rate. However, the GB% difference is one that cannot be simply dismissed.
Hudson's numbers after his LOB% peak
We may be able to hypothesize that Hudson’s extreme groundball tendencies help him keep his BABIP low. Ground balls usually have a BABIP of .235 (Read: They become hits 23.5% of the time), so more ground balls would pull Hudson’s BABIP down.
His BABIP remained low in subsequent seasons, so he was able to maintain success despite strand rate regression.
His BABIP remained low in subsequent seasons, so he was able to maintain success despite strand rate regression.
Johnny Cueto

So far, Kuroda and Vogelsong have been very good comparisons for Iwakuma, except for their fastball velocity. Cueto falls into the same category, as his fastball is around 3.3 mph faster than Iwakuma’s. However, his other numbers are nearly identical.

Cueto's numbers after his LOB% peak
Cueto has maintained his high LOB%, and kept his BABIP low. However, it is important to take the difference in fastball velocity into consideration when evaluating the comparison. However, it still gives hope that Iwakuma may be able to maintain his high strand rate.
Clay Buchholz

Buchholz is another example of a pitcher who throws much harder than Iwakuma, and has worse control. He exceled at limiting home runs, however, something that not all of the pitchers in the study had done.
Buchholz's numbers after his LOB% peak
Similar to the other comparisons, Buchholz’s LOB% dropped in the following season. However, he did rebound in 2013, which helped him post the best ERA of his career, but the trend did not continue, as he has regressed once again 2014.
In Summary:
In Summary:
What does this mean for Iwakuma?
Based on Iwakuma’s performance in September and October 2014, and the comparisons between him and other pitchers, it seems like he will not be able to sustain the high strand rate and low BABIP. While the end of the 2014 season was a clear overcorrection, his strand rate and BABIP should regress to league average in 2015. This will hurt his overall production, as his ERA should rise as well. This does not mean that he will no longer be a good pitcher, but may not be the elite pitcher he was during the beginning of his career.
All statistics used are from FanGraphs.
All statistics used are from FanGraphs.
 RSS Feed
