
Starting pitcher Drew Hutchison was drafted in the 15th round of the 2009 MLB draft out of Lakeland High School, in Lakeland, Florida by the Toronto Blue Jays. After progressing through the lower levels of the Minor Leagues, he was called up to the Blue Jays and made his first professional start on April 21, 2012. Hutchison was shelved after only 11 starts when he was diagnosed with a strained ulnar collateral ligament, which would ultimately require Tommy John surgery.
Hutchison spent the entire 2013 season rehabilitating his elbow, and returned to the Major Leagues at the start of the 2014 season. He posted an 8.97 K/9 which ranked 16th highest in the league that season, ahead of aces like Johnny Cueto and Cole Hamels. Despite this firepower, he managed only a 4.48 ERA and a 3.85 FIP in a tumultuous, streaky season.
However, Hutchison’s peripheral stats suggest that he should have had much more success in 2014 than his surface stats show.
What really burned Hutchison during the 2014 season was home runs. He gave up 1.12 HR/9, which was 11th most in the league, and was much higher than the league average of 0.91 HR/9.
As we look deeper, we see that Hutchison’s batted ball profile was a mess. A comparison of Hutchison’s stats to the league averages for these batted ball stats is shown below, and the differences between the two are clear.

From the table, we can see that Hutchison allowed more fly balls per balls in play than the rest of the league, which in turn decreased the number of groundballs he was generating.
It may be easy to conclude that Hutchison is destined for the bullpen until he solves this home run problem, but I wanted to try to pinpoint a specific pitch that was causing this issue.
Hutchison’s fastball had a 47.8% FB%, which was more than double the league average rate for fastballs of 20%. However, his home run rate on this pitch was only 3.5%. So, he was allowing fly balls, but they were not leaving the field very often. This, generally, is a slippery slope. Studies have shown that pitchers have control over the amount of fly balls they allow, but have very little control over how far they end up going. So, the difference between a homerun and a fly ball being caught on the warning track has much more to do with luck, park factors and weather than the pitcher’s skill.
But, the root of Hutchison’s fly ball problem is apparent after looking at heat maps of his fastball location - Hutchison left many fastballs up in the zone last year.
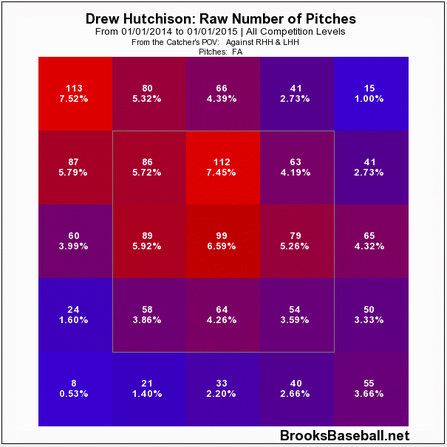
Drew Hutchison's fastball usage, 2014
Furthermore, this second heat map demonstrates that the fastballs that he did leave up in the zone were often hit far in the other direction.
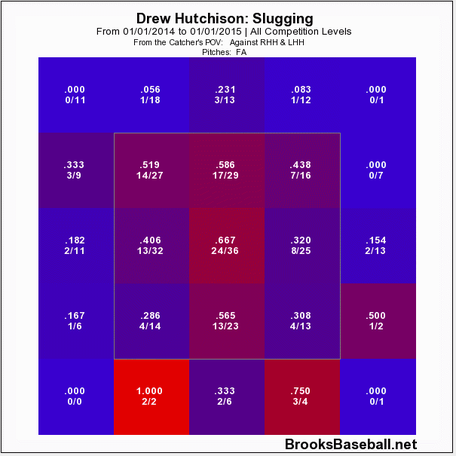
Slugging Percentage against Drew Hutchison's fastball, 2014
I’m no pitching coach, but this control issue seems to me like a problem that can be fixed in the offseason.
In addition to his fastball, his changeup’s batted ball profile appears to be a root of potential problems.
Mark Rosenberg (of The Rosenblog) and I are currently working on a project where we are looking for correlations between physical aspects of pitches (like movement, velocity, etc.) and batted ball types. So far, we have found that there is essentially no correlation between LD% and velocity, horizontal movement, and vertical movement. (We are hoping to release this study in a few months.)
Hutchison’s changeup was hit for a line drive on 32% of the balls hit into play, while the league average for changeups was only 23%. However, our study suggests that this is a problem of location, or a fluke, and not a problem with the physical aspects of his changeup.
Additionally, his changeup was generating ground balls on only 38% of the balls in play, which was well below the league average of 50.96%. This also raised some questions: Is his changeup not good at getting ground balls, or was this just an unlucky stretch as he became accustomed to the major leagues? To answer this question, I again turned to the project that Mark and I are working on.
In addition to investigating pitch aspects and their influence on batted balls, we created a model to predict groundball percentage for a pitcher’s changeup. After plugging in the necessary data, we saw that Hutchison had a sizeable difference between his actual GB% for his changeup and his expected GB%.
According to the model, Hutchison should have generated 56% ground balls on his changeup. From this, we can conclude that he should regress upward toward his expected groundball percentage in 2015, and see more success.
Furthermore, the issues that his groundball rate caused are seen in the averages for his changeup. In 2014, Hutchison allowed a .333 BAA (batting average against) and a .313 BABIP on his changeup, while the league average was .240 and .279, respectively. Because groundballs have a BABIP of .235, we can conclude that had his changeup generated more groundballs, his BABIP for the pitch as a whole would been dragged down closer to the league average. This would have helped him have more success in 2014, and is a change that I expect to see in 2015.
So what does this all mean?
Overall, the apparent flaws in Hutchison’s arsenal actually appear to be instances of him getting unlucky or underperforming, which hopefully can be fixed relatively easily. Hutchison’s changeup looked like a terrible pitch at first glance, but he should expect regression in 2015. For his fastball, fixing some location issues can help prevent hits on it from resulting in extra bases.
One concern, however, is his innings count. He has already been under the knife for Tommy John surgery, and he increased his workload by 130 innings last year. 200 total innings may be a stretch, but I think that close to 190 innings is a safe bet for 2015. Assuming he stays healthy, Drew Hutchison seems poised to break out in 2015 and emerge as one of the game’s young stars.
Statistics used are from FanGraphs, Brooksbaseball, and Baseball Prospectus.
 RSS Feed
